I have spent more than 100 hours with GPT-6 and several thousand dollars using it. You do not need to start with that kind of spending. Start with one task that leaves you with a useful file.
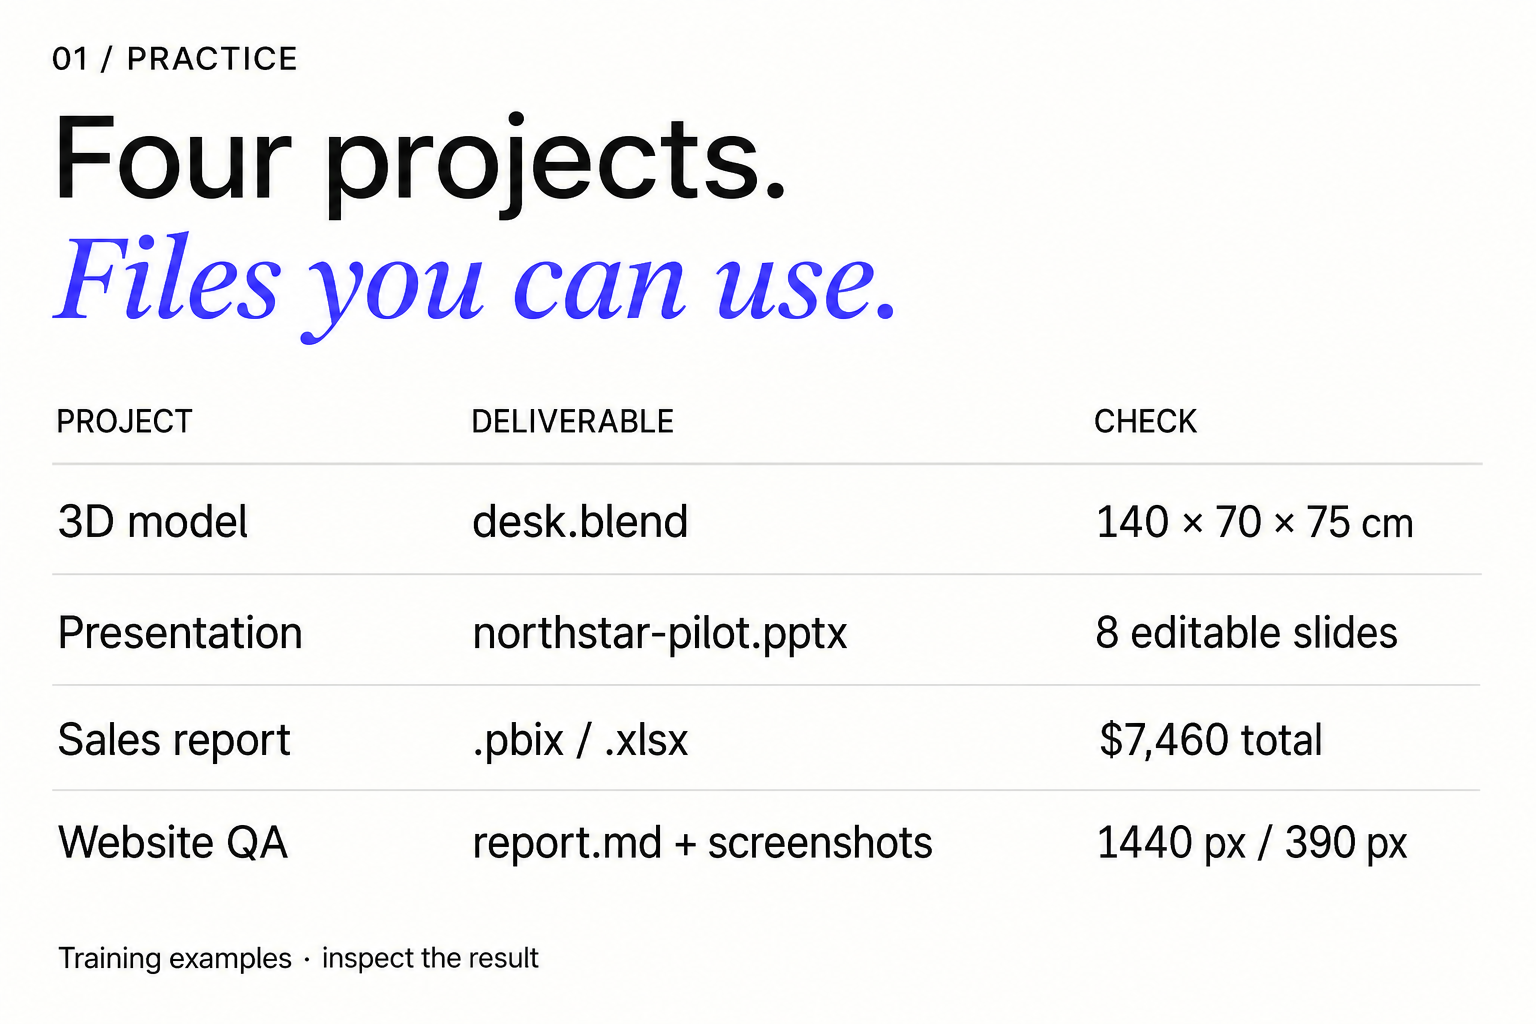
The video covers four directions: 3D, presentations, analysis, and website testing. This guide explains how to try them: where to select Astra, which materials to provide, and what to check before using the result.
For a first run, I would choose a presentation or a small spreadsheet. You can quickly see whether the model understood your material. 3D also needs Blender, and website testing needs a browser the agent can operate.
How to get access to GPT-6 Astra
Astra runs in the cloud. There is no separate “GPT-6 installer.” These projects use ChatGPT Work or Codex with access to your files and the tools each task needs.
As of September 7, 2026, OpenAI has announced a phased rollout to ChatGPT Plus, Pro, Business, and Enterprise. Astra may therefore not yet appear in your selector even on an eligible plan. This free guide does not provide free model access. Official access and model-selection sources are listed at the end.
- 1. Sign in to ChatGPT and switch to Work. If you already use Codex, you can stay there.
- 2. Open the model or Power selector near the composer. Check Advanced if Astra is not immediately visible. Select GPT-6 Astra only if your account has access.
- 3. For files and apps on your computer, use the desktop app with Work locally. A cloud task does not automatically gain access to your local Blender or Power BI installation.
- 4. If Astra is missing, check the official Models page for your plan and rollout. For a company account, also check with your administrator. Typing a model name into a prompt does not switch models.
- 5. Check your remaining usage before a large task. Start with a small project and a normal reasoning setting; increase it when you identify a specific problem in the output.
Prepare one project folder
The starter pack has four independent folders. Each contains an English prompt-en.txt and materials for the first run. Extract it and open only the folder you need in Work or Codex: 02-presentation for slides, or 03-sales for analysis.
These are training inputs, not a claim that Astra has already completed the projects. Northstar is fictional, and the sales file deliberately includes a repeated order and a missing region so you can check whether the agent notices them.
Before the main prompt, send the short readiness check below. If the agent cannot see a file or use a required app, resolve that first. Asking it to try harder cannot replace missing access.
Before starting, list the input files you can actually read and the tools available for this project. Check whether you can create and save the requested output format. Report any missing dependency or access. Do not install software, buy anything, or begin the main task yet.
The copy includes a link to the resource library. For agents ↗
1. 3D designer: build a product model you can edit
Suppose you need to show a new desk in a product listing. You want several angles and a source file where you can later change the legs or tabletop dimensions. That is why this project creates a Blender scene.
The 01-3d folder contains brief.txt: a 140 × 70 × 75 cm pale oak desk with four black metal legs. It is a concrete first task. For your own product, replace the dimensions, materials, and intended use, and add photos from several angles. A single photograph leaves the hidden side ambiguous.
Install Blender from its official website, open a local task, and give it access to this folder. Ask it to check for Blender and its Python API, then send the prompt. OpenAI’s architectural example demonstrates work through Blender with rendered checks; this desk is a separate training exercise.
Act as my 3D artist. Use brief.txt to create an editable Blender scene of the desk.

First check that Blender and its Python API are available. If not, tell me exactly what is missing; do not claim you built or rendered the scene. Do not install software or purchase assets without asking.

Use metric units. Model the 1400 x 700 x 750 mm desk with a 30 mm oak top and four 40 x 40 mm matte black metal legs. Keep the top and legs as separately named objects. Use the dimensions and materials in the brief; list any assumptions.

Add a neutral studio background and lighting. Render front, three-quarter, and detail views at 1920 x 1080. Inspect the renders and fix visible intersections, floating parts, missing materials, and framing problems.

Save desk.blend, build_scene.py, the three PNG renders, and README.md in output/. In the README, record the final overall dimensions, how to open the file, and anything you could not verify. Reopen the saved scene if the tools allow it and report the result. Finish with links to the files.
The copy includes a link to the resource library. For agents ↗
Check the 3D result, then move toward property visualization
Open desk.blend in Blender. Select the tabletop: it should be a separate object. Check the dimensions and all three renders. The legs should meet the floor, parts should not intersect, and the oak should behave as a surface material.
If you find a defect, point to it directly: “The rear leg intersects the tabletop in the detail view; fix the joint and render that view again.” That gives the agent a specific correction.
For property visualization, start with a dimensioned plan showing rooms, windows, doors, and passages. Review simple geometry before adding furniture and finishes. If you need a walkable tour, make Unreal Engine 5 transfer a separate next step, including scale and collision checks. It requires an installed Unreal Engine and access to it. Do not make that entire chain your first experiment.
The house model is a visualization, not a construction design or a certification of measurements.
2. Presentation designer: your material and your style
“Make a beautiful presentation” leaves too many decisions unspecified. Give the agent the meeting’s decision, source facts, and a design reference. It can then turn that material into slides you can actually use.
The 02-presentation folder contains source-notes.md and brand.txt. The first describes a fictional AI support pilot; the second defines colors, fonts, and layout rules. For real work, replace these with your notes and attach an existing company presentation as PPTX or PDF. Specify which slides to follow and which elements to preserve.
For a first run, use the two training files and the prompt below. The proposed schedule and pilot criteria are explicitly separate from measured results: the fictional company has no measured savings to claim.
Act as my presentation designer. Create an eight-slide, editable PowerPoint deck from source-notes.md and brand.txt. This is a training example about the fictional company Northstar; label it accordingly.

Audience: operations leadership. The decision is whether to approve a two-week internal support pilot.

Read both files before designing. Build these eight slides: decision, current process, bottleneck, proposed workflow, pilot scope, measurement, risks, and next step. Keep one main point per slide. Separate proposals from measured results. Do not invent savings, customer quotes, baseline measurements, names, or evidence.

Follow the colors, typography, spacing, and restrained style in brand.txt. Keep text and diagrams editable. Use simple shapes for the workflow. Add speaker notes that point to the relevant part of source-notes.md.

Save northstar-pilot.pptx and a PDF preview in output/. Render and inspect every slide. Fix clipped text, overlaps, weak contrast, and text too small to read. Check that all eight slides exist and disclose any export or editing limitations. Finish with links to the files.
The copy includes a link to the resource library. For agents ↗
Review the deck as if you were presenting tomorrow
Open the PPTX and try editing a title and one diagram element. If each slide is a single image, the editable-file requirement has not been met. Then review the PDF: all eight slides should be readable without zooming.
Check numbers against the source. In this exercise, “we will measure time” must not become “we saved 40%.” Check every percentage, deadline, and customer quote in your real deck the same way.
In OpenAI’s example, Astra used a few template slides to make a deck about the fictional model GPT-Gaia. It illustrates style matching; it does not guarantee your material needs no revision. If one slide is overloaded, identify its number and the single point it should retain.
3. Data analyst: find out what actually sells
The task is to see revenue by month, product, and region. Start with a small table whose totals you can calculate yourself.
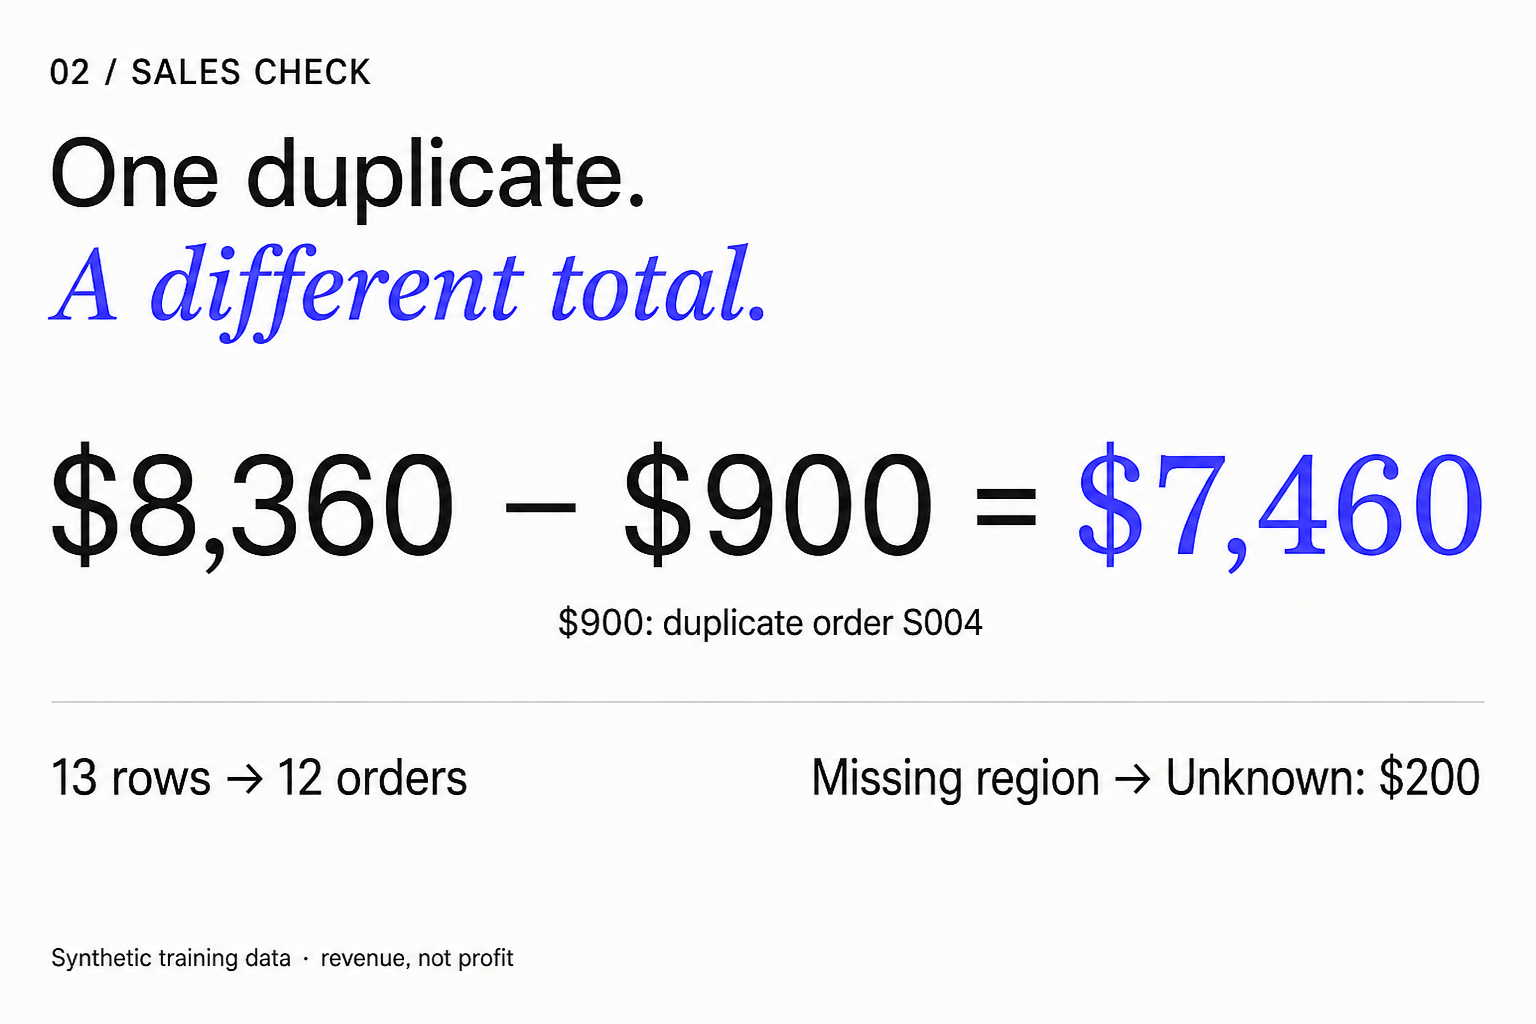
The 03-sales folder contains sales.csv and data-dictionary.md. There are 13 raw rows: one order is repeated and another has a missing region. These issues are intentional. If the agent immediately draws a chart without noticing them, the report is not ready to trust.
On Windows, use an installed Power BI Desktop. Microsoft documents it as a Windows application. On a Mac, the prompt requests an XLSX workbook and an HTML dashboard with filters instead. Renaming a file to .pbix does not create a Power BI report.
Attach the CSV and data dictionary. Keep expected-results.json aside as your answer key. For real exports, first define how to handle returns, discounts, taxes, and currencies; none are present in this training file.
Act as my data analyst. Use sales.csv and data-dictionary.md to build a sales report. All data is synthetic and all money is in USD.

Start by inspecting the columns, data types, row count, duplicate order IDs, and missing values. Show the exact issues you find. Count an exactly duplicated order only once, keep an audit of removed rows, and put missing regions in an explicit Unknown group. Do not modify the original CSV. If rows share an order ID but have different values, ask how to resolve the conflict.

Calculate revenue as quantity * unit_price_usd. Show total revenue, monthly revenue, revenue by product, and revenue by region. Reconcile every breakdown with the same cleaned-data total. Do not call revenue profit or invent reasons for changes.

If Power BI Desktop and the required computer-use tools are available, create a report with a total-revenue card, monthly chart, product ranking, region breakdown, and date/region filters. Verify the filters and save sales-report.pbix.

If Power BI Desktop is unavailable, create sales-report.xlsx and a self-contained HTML dashboard with date and region filters. State this substitution clearly; do not label another file as PBIX.

Also deliver cleaned-sales.csv, cleaning-log.md, and findings.md. In findings.md list three observations supported by exact figures, the reconciliation totals, and any checks you could not perform. Save everything in output/.
The copy includes a link to the resource library. For agents ↗
The check: $7,460, not $8,360
The file has 12 unique orders. S004 is repeated exactly, so its $900 revenue must count once. After removing the exact duplicate, total revenue is $7,460. A total of $8,360 means the duplicate was counted.
July contributes $3,300 and August $4,160. By product: desks $3,300, chairs $2,760, lamps $1,400. By region: North $4,240, South $3,020, Unknown $200. Each breakdown must reconcile to $7,460.
Select North: the total should become $4,240. Also select August: it should become $2,640. This checks the report’s filtering behavior as well as its arithmetic.
You can conclude that desks generate the most revenue. You cannot call them the most profitable: there is no cost data. August’s higher revenue does not prove an advertising campaign worked. The report must distinguish observations from explanations that need more evidence.
4. Website tester: get a list of reproducible defects
Before running ads, check where buttons lead, whether pages open, and whether the site works on a phone-sized screen. Give the agent one specific site and require evidence for each defect.
Open 04-website-qa, replace [URL] with your website, and provide scope.md. Confirm that the agent can open the page in a browser and capture screenshots. The prompt already specifies 1440 × 900 and 390 × 844 viewports.
This first pass checks the interface without submitting forms. Test lead submission or checkout separately in a staging environment with test data, so a test does not create a real lead or order.
Act as my website tester. Audit [URL] using an available browser tool at 1440 x 900 and 390 x 844. Read scope.md first.

Check the header navigation, visible buttons, internal links, article or product cards, search if present, and forms. Do not submit forms, place orders, send messages, modify data, or bypass authentication. Report submission behavior as not tested. If browser automation is unavailable, explain the blocker instead of inventing results.

For each suspected bug, reproduce it, record the exact URL and viewport, and capture a screenshot. Write clear steps, expected behavior, actual behavior, impact, and screenshot path. Distinguish a product defect from a network failure or tool limitation. Do not invent issues to fill a quota.

Deliver output/report.md, output/coverage.csv, and output/screenshots/. In coverage.csv record each checked feature, viewport, and status: pass, fail, or not tested. Include the reason for every not-tested item. Do not fix the site in this run.
The copy includes a link to the resource library. For agents ↗
A useful bug report can go straight to a developer
“Mobile is broken” is not actionable. A useful entry reads: “At 390 px, open the menu and select Contact. The menu overlaps the link and the section cannot be reached. Expected: navigate to Contact. Screenshot: screenshots/mobile-menu.png.” This is an example report format, not a defect found on your site.
Open the report and reproduce the highest-impact issues. Each screenshot should have a page URL, viewport, and steps. Check coverage.csv for untested items. If a form was not submitted, the agent cannot confirm that the lead was delivered.
Do not demand exactly ten bugs. There may be two, or the test may be blocked by authentication. An accurate coverage record is more useful than a long speculative report.
How to repeat a result that works
Once a project works, keep the whole folder: inputs, prompt, deliverables, and your corrections. Next time, replace the material while keeping the checks. For a presentation, check editability and facts; for a report, check duplicates, missing values, and reconciliation.
If the task repeats weekly, you can turn that tested procedure into a skill. First confirm it on at least one real example. A saved instruction saying “you are an analyst” does not define how your company calculates revenue.
Choose one of the four projects and finish with a file that opens and passes its checks. Then adapt the approach to your work.
Sources & context
- OpenAI — GPT-6 Astra
Announcement, availability, and official demonstrations. These demos are not outputs from our prompts.
- ChatGPT Work — Get started
Work mode, local tasks, files, and tools.
- OpenAI — Models
Selecting Astra and account/rollout differences.
- OpenAI — Architectural visualization with Astra
Thomas Ricouard on Blender, rendered checks, and Unreal Engine transfer.
- Blender — Download
Official Blender download for the 3D project.
- Microsoft — Get Power BI Desktop
Power BI Desktop installation and Windows requirements.
See you in the next piece.
Back to the journal